
I’ll never forget a meeting at a coffee shop in downtown Seattle in 2018.
I was less than a year into helping launch Nori, a carbon removal market place, and we were sitting down with Dr. Emma Fuller, then at Granular, to sketch out a potential pilot for paying farmers to increase soil organic carbon.
The hypothesis was pretty simple:
Much of the data needed to quantify carbon outcomes was already being collected in farm management software: field boundaries, crop information, yields, fertilizer applications, management practices and so on. Farmers had a reason to keep that data accurate because they used it to run their farms and make agronomic decisions. What was missing was a way to reuse it for another job: quantify a carbon outcome, verify it, and transact value back to the farmer.
We had already begun working with the team behind COMET farm at Colorado State University to access its greenhouse gas modeling through an API. Granular represented another piece of the system: a way to get the required farm data without asking producers to start from scratch.
That part worked. Nori ultimately transacted more than $1 million to farmers who were storing carbon in their soils and reduced a process that could take years to establish a baseline and enroll a project down to weeks.
The company itself ultimately failed for reasons I won’t unpack here. My own TL;DR is that the bigger problem wasn’t necessarily the data architecture. It was product-market fit: was this the right use case, solving an important enough job, for someone willing to pay?
That experience left me with a lesson I keep coming back to: The same data can do many jobs.
But “use the data many times” only works if you understand what each downstream user is trying to accomplish.
Start with the job
Almost any attempt to turn agricultural data into value must answer some version of the same questions:
- Who is trying to do what?
- What information do they need?
- How can that information be collected?
- What needs to be calculated from it?
- What ultimately makes the result valuable?
I’ve started thinking about this as a common architecture:
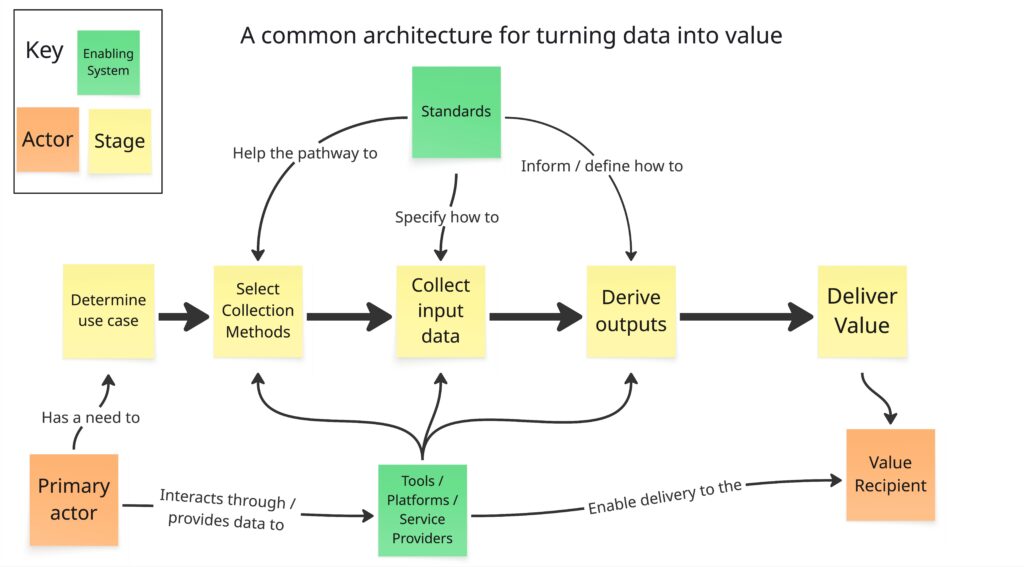
The boxes are common.
What happens inside them is not.
A farmer deciding whether to switch crops might need yield expectations, irrigation requirements, costs, price and expected margin.
A procurement team comparing feed ingredients might care about delivered price, available volume, nutritional value, animal performance, supply reliability and environmental attributes.
A sustainability team preparing an inventory might care much more about boundaries, consistent calculation methods, evidence and assurance.
Same architecture. Different job. Different definition of “good enough.”
Where this breaks today
The problem is not always that the data doesn’t exist.
It’s that the same information gets requested over and over, lives in different systems, uses different definitions, and often ends up in a report without helping anyone make a better decision.
A producer may get asked for the same field boundary, crop, yield, irrigation, or management data by an agronomist, a buyer, a carbon program, a lender, and a sustainability team.
Each may ask for it in a different form, portal, or spreadsheet.
Meanwhile, the people asking for the data may still struggle to answer a basic question:
What am I supposed to do differently because of this number?
The producer may be asking: Why am I entering this again?
The buyer may be asking: Can I compare my options?
The sustainability team may be asking: Can we stand behind this number?
And the farmer may simply be asking: Is the juice worth the squeeze?
A technically correct number is not always a useful one.
Water makes this particularly obvious
We’ve been spending a lot of time lately thinking about agricultural water accounting, and it has reinforced this point. We recently released a white paper on animal resilience in the high plains and one of the clearest lessons was that the challenge isn’t simply measuring water. It’s connecting the data to the farm, sourcing, feed, investment, and regional decisions that determine whether change actually happens.
That is part of what pushed me toward this broader way of thinking about the problem.
Take some fairly ordinary farm data:
Field boundary. Crop type. Acres. Yield. Planting and harvest dates. Irrigation. Management practices. Energy use.
A lot of that same information already shows up in carbon accounting.
Now add a few water-specific elements: groundwater pumping, evapotranspiration, water source and the local condition of the resource, and suddenly the same underlying operational record can begin answering a very different set of questions.
For example:
Carbon: What were the emissions or removals associated with production?
Water: How much groundwater was withdrawn? How much water was used per acre or unit of production? What does that amount mean in this particular aquifer?
Farm economics: Did using less water reduce yield? Did the crop switch improve or hurt margin?
Feed: If a lower-water crop enters a ration, what happens to feed cost and animal performance?
Procurement: Can I source enough of it, at the right price and specification?
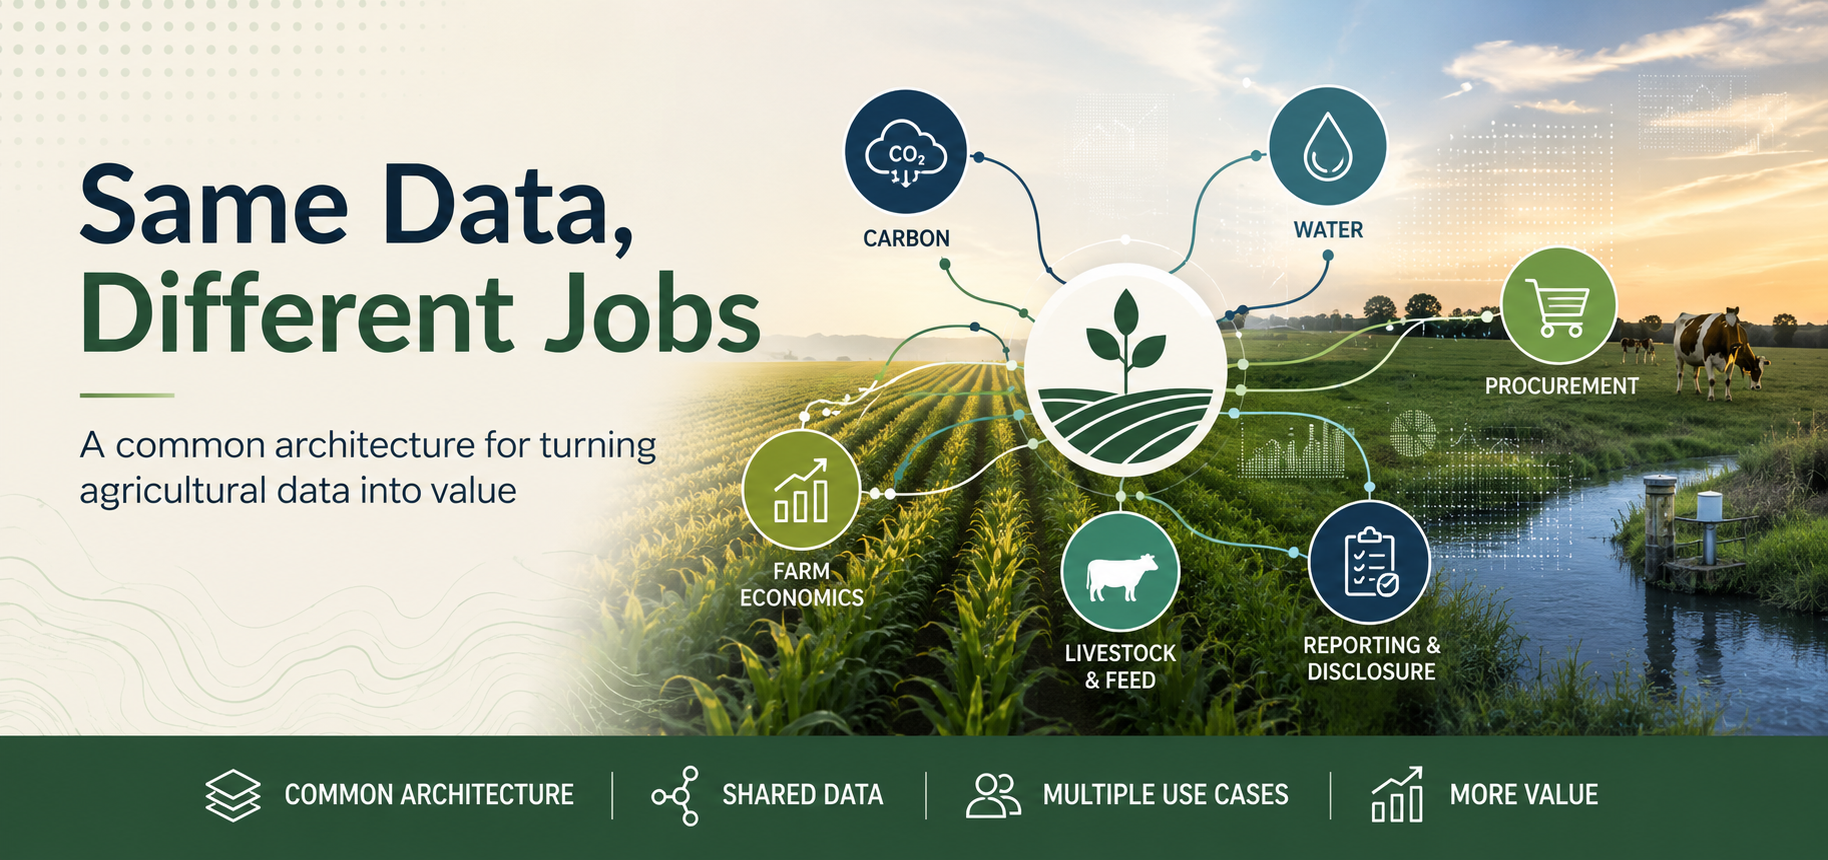
These aren’t five separate universes of data.
They are different pathways through a partially shared information architecture.
And that matters because I think we often start in exactly the wrong place.
We debate the metric. Or the methodology. Or the platform.
Meanwhile the person providing the data may be wondering: Why am I entering this again?
The procurement team may be wondering: What am I supposed to do differently because of this number?
And the producer may simply be asking: Does it pencil?
A technically valid output is not necessarily a valuable output.
Enter data once. Use it many times.
My friend Greg Austic, founder of Our Sci, has a mantra I’ve heard him often repeat:
“Enter data once, use many times.”
I increasingly think this is the opportunity.
Not one platform to rule them all. Not one metric that answers every question.
Instead: understand the common information underneath multiple jobs, make that information easier to move between systems, and be clear about the additional data, calculations and evidence each use case requires. Contextualized, localized, and suited to the job.
That also means the strongest data systems may be ones where the person supplying the data has a reason to keep it accurate even if the sustainability program disappeared tomorrow.
Farm records exist because someone needs to run the farm.
Feed records exist because someone needs to formulate a ration.
Meters exist because someone needs to understand pumping.
Procurement systems exist because someone needs to buy something.
Carbon accounting, water accounting, risk management, incentive design, and environmental reporting can all build from that operational foundation.
They don’t have to be the reason the data exists in the first place. And by focusing too narrowly on one use case, we can miss the proverbial forest for the trees: the broader system of economic and environmental trade-offs in favor of individual market mechanisms, metrics, or use cases with neatly defined methods, inputs, outputs, and value.
What this looks like as structured data
To make this more concrete, I started mapping these relationships in Airtable, focused initially on U.S. agriculture. The point isn’t the database itself. It’s to see where different jobs rely on the same underlying information, and where they don’t. Rather than starting with a sustainability metric, I started with the jobs and worked backward.
Use cases
Here’s a current list of the jobs we’re starting to map for U.S. Agriculture to deliver ecosystem services: from making a crop decision, to sourcing an ingredient, to understanding risk, financing a change, or preparing an environmental inventory. The important thing is that each job may need a different answer, even when much of the underlying data is the same.
Data elements
What information does each job need?
This current list includes both the information that goes into the system: things like acres, yield, irrigation, costs, or ration composition, and the numbers that can be calculated from it, like margin, water use per unit of production, or GHG emissions. The overlap is where reuse becomes possible.
Collection methods
Here’s a list of various data collection methods. Some data is measured directly. Some comes from farm records, equipment, software, receipts, public datasets, remote sensing, or models. The right source depends on the job: a number used for an internal decision may not need the same level of proof as one used to make a payment or public claim.
So what
Explore the lists, filter by job, and look for the overlaps. That is where the opportunity starts to show up. If you have comments, suggestions, or want access to the underlying database please get in touch. What I find most interesting isn’t any individual table above. It’s the overlap, and the iterations across the fuller system.
Yield can matter to agronomic decisions, farm economics, sourcing, carbon accounting, and water productivity.
Irrigation can matter to production, cost, carbon, and water.
Ration composition can connect crop production to feed sourcing, animal performance, and ultimately the water or carbon associated with an animal product.
That starts to create a much more useful question than: Which platform is best?
Instead: For this job, what information is required, what already exists, what needs to be derived, and which systems can actually help deliver the outcome?
Build this with us
In the past, we’ve made landscape maps outlining the various tools or companies involved in delivering ecosystem services. This was actually the genesis behind the name “Carbon A List.” Those maps weren’t wrong. But to be truly useful, they started (at least) one layer too late. They mapped the solutions before fully mapping the jobs, information requirements, and relationships underneath them. And they were still looking at the world through a pretty carbon-centric lens. Now I can’t unsee the world as an interconnected system: multiple actors, mechanisms, and use cases, all capable of getting to similar outcomes in different ways. So now that the foundation exists, we want to build the next layer from the ground up. We’re building an open landscape map of the tools, data, jobs, and use cases that support ecosystem services in U.S. agriculture.
If you operate a platform, tool, dataset, model, or service that fits somewhere in this architecture, I want to make sure it is represented correctly.
Tell us (and those interested to learn more about you) what data you use, what you produce, which jobs you support, which standards you work with, and where your tool fits in the broader ecosystem.
And if you’re on the demand side, with a job that existing data or tools still aren’t solving well, tell us about the job. Fill out the framework as far as you can. I’m happy to walk through it with you and figure out where the gap sits: the data, the method, the standard, the tool, the value proposition, or something else.
Start with the job.
Work backward from there.